0
Total Cases
0%
Win Rate
0%
Response Rate
0%
Interview Rate
$0
Confirmed Revenue
0%
Repeat Client Rate
Key Insights
Top 10 findings from 97 Upwork cases
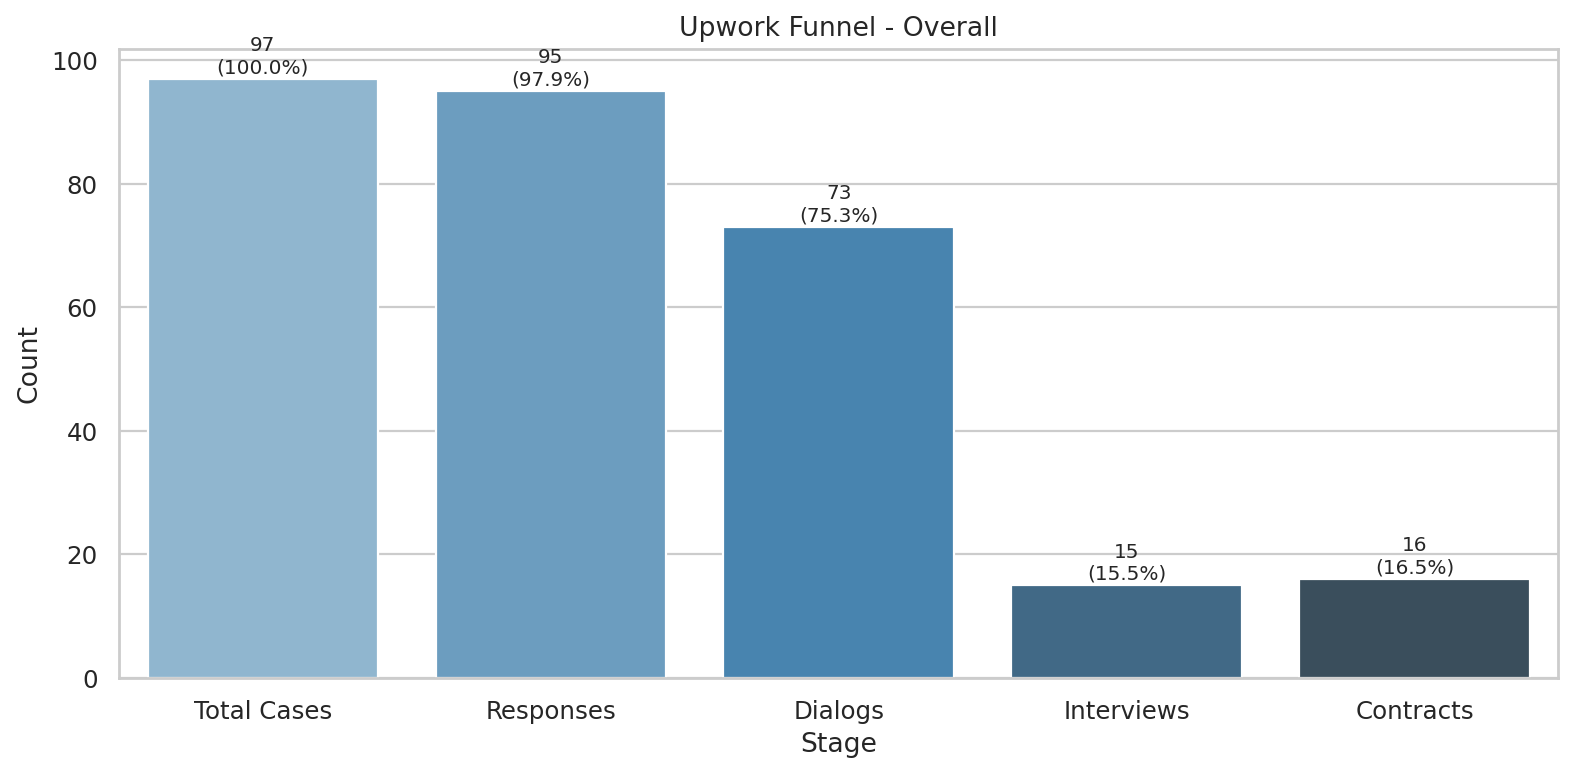
- Overall funnel: 95/97 responses (97.9%), 73 dialogs (75.3%), 15 interviews (15.5%), 16 contracts (16.5%).
- Best win-rate year: 2023 with 33.3% (1/3 cases). 2025 trending up at 20.0% (9/45).
- Outbound converts at 23.7% vs inbound at 11.9% — nearly 2x better.
- Urgent client intent has the highest win rate at 30.0% (3/10).
- High conversation depth has the highest win rate at 28.9% (11/38).
- Top industry: E-commerce at 23.8% win rate (5/21 cases).
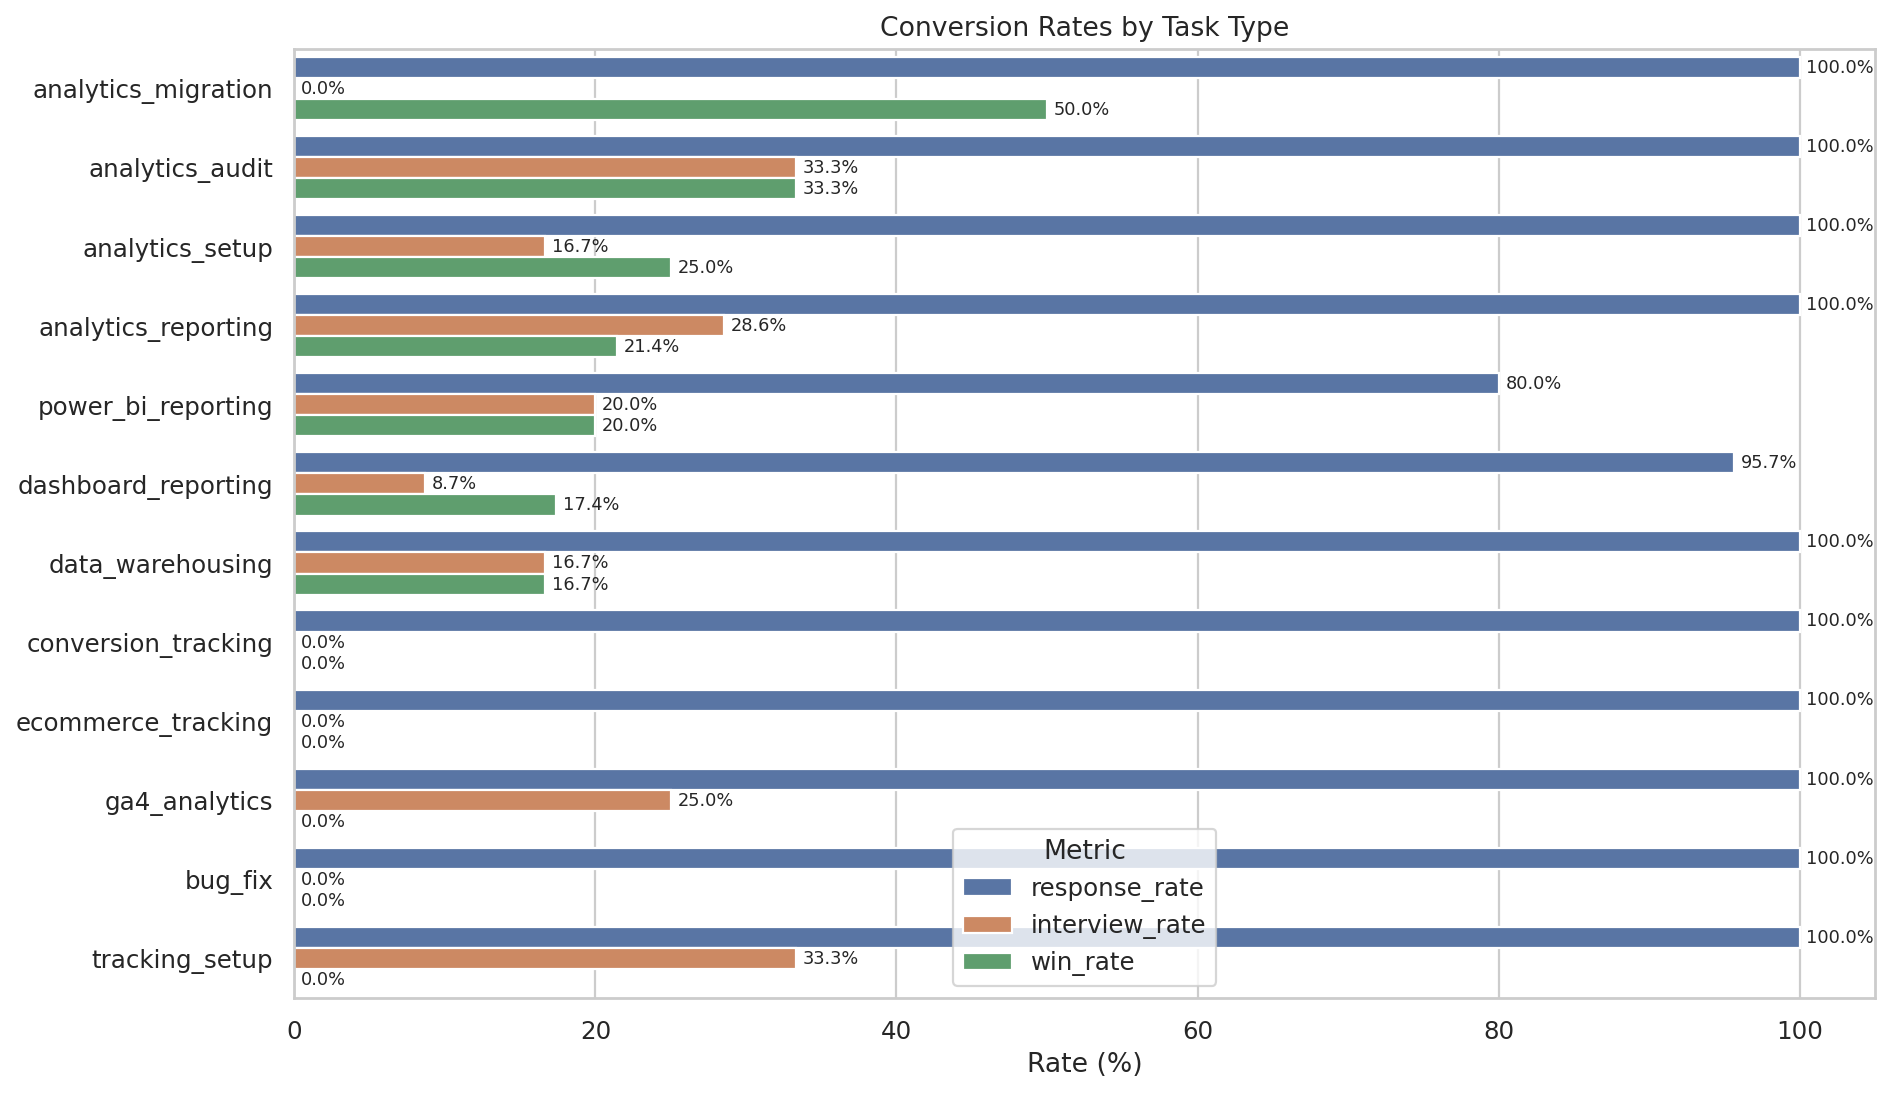
- Top task type: analytics_migration at 50.0% win rate (1/2 cases).
- Confirmed revenue: $713 across 10/16 contracts. Booked proxy: $1,014 across 12/16 contracts.
- Repeat clients: 7/16 won contracts (43.8%), contributing $122 proxy revenue (12.0%).
- Main loss point: negotiation stage with 50 lost cases. Most common: dropped_during_negotiation (48 cases).
- True lifetime revenue likely higher than confirmed — only 12/16 wins have usable budget data.
- Proposal-type effects unreliable — dataset mostly unlabeled (no explicit boosted records).
- Very high response rates suggest curated conversation records, not raw proposal exports.
Metric Definitions
Response Rate = responses / total_cases
Dialog Rate = dialog_started / total_cases
Interview Rate = interviews / total_cases
Win Rate = contracts / total_cases
Confirmed Revenue = sum(final_budget) where contract=1
Booked Proxy = final_budget or expected_budget where contract=1
Funnel Analysis
Conversion metrics from first contact to contract
Interactive Funnel Overview
Overall Funnel
Funnel by Year
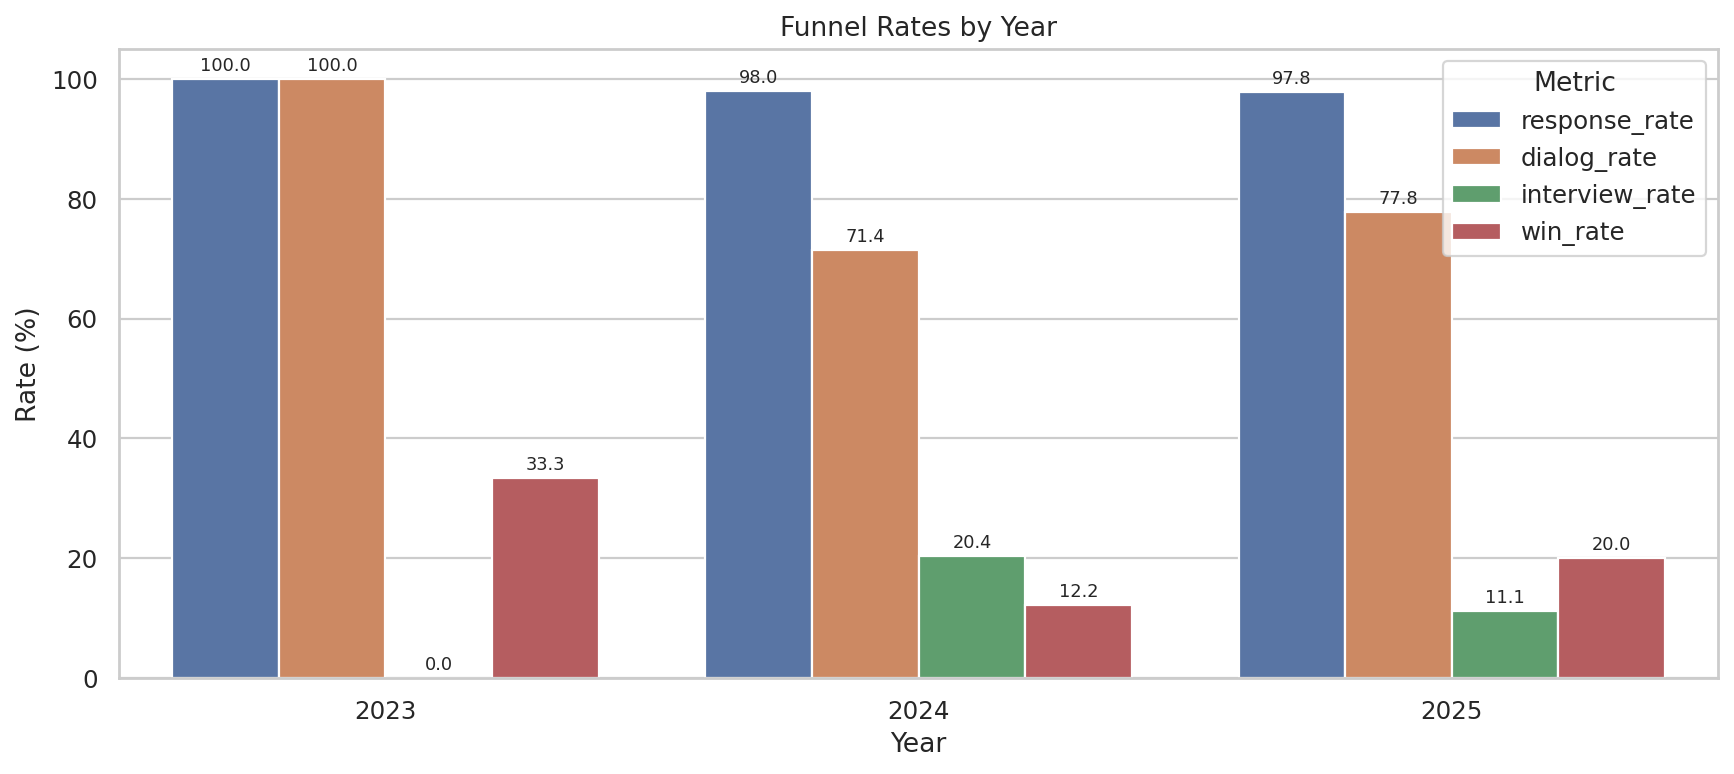
| Year | Cases | Responses | Dialogs | Interviews | Contracts | Response % | Dialog % | Interview % | Win % |
|---|---|---|---|---|---|---|---|---|---|
| 2023 | 3 | 3 | 3 | 0 | 1 | 100.0 | 100.0 | 0.0 | 33.3 |
| 2024 | 49 | 48 | 35 | 10 | 6 | 98.0 | 71.4 | 20.4 | 12.2 |
| 2025 | 45 | 44 | 35 | 5 | 9 | 97.8 | 77.8 | 11.1 | 20.0 |
Benchmark Comparison vs GigRadar/Convertix 2025
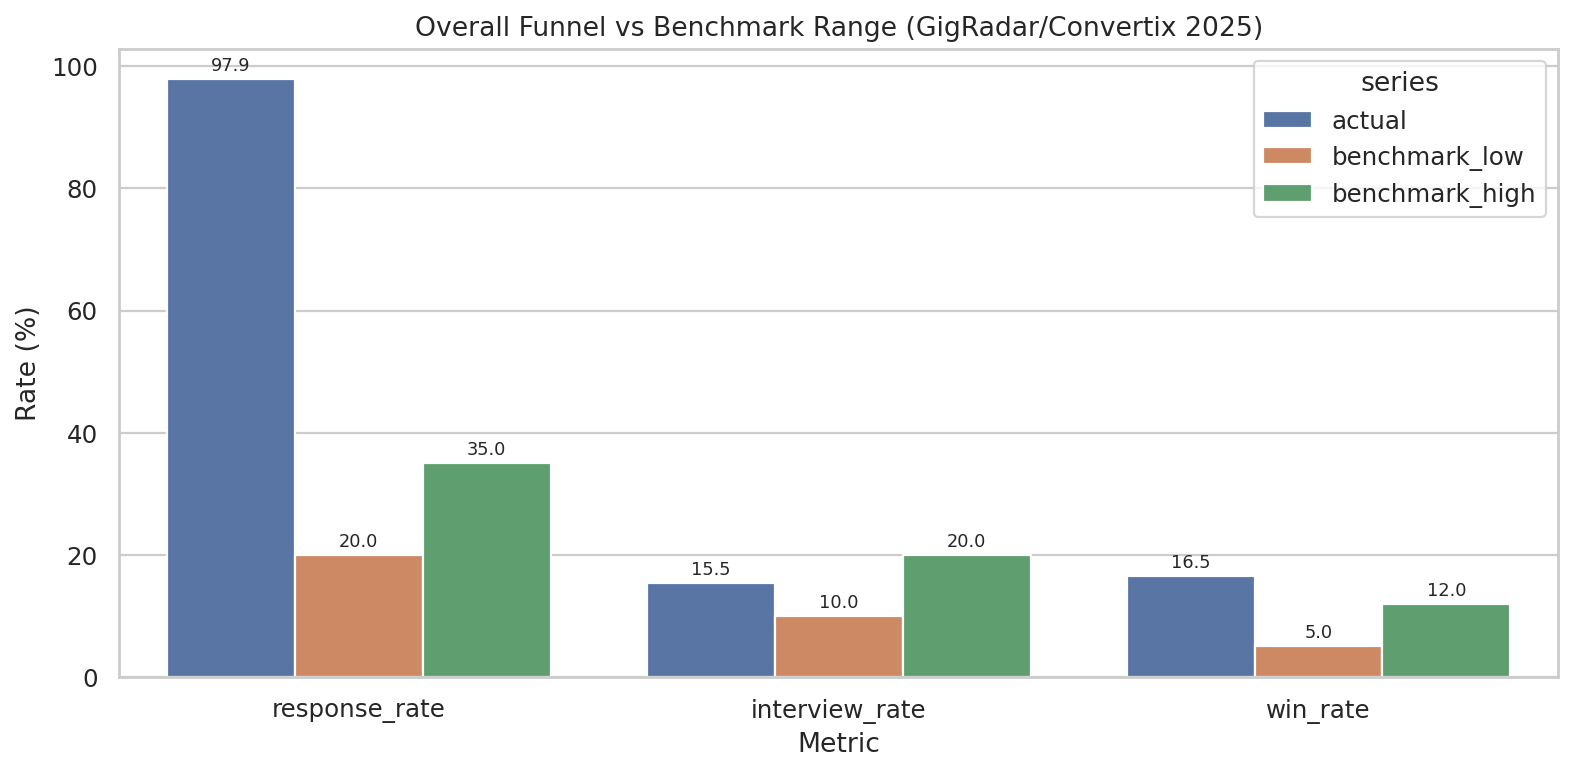
- Response rate 97.9% — well above benchmark range of 20-35%.
- Interview rate 15.5% — within benchmark range of 10-20%.
- Win rate 16.5% — above benchmark range of 5-12%.
Inbound vs Outbound Funnel
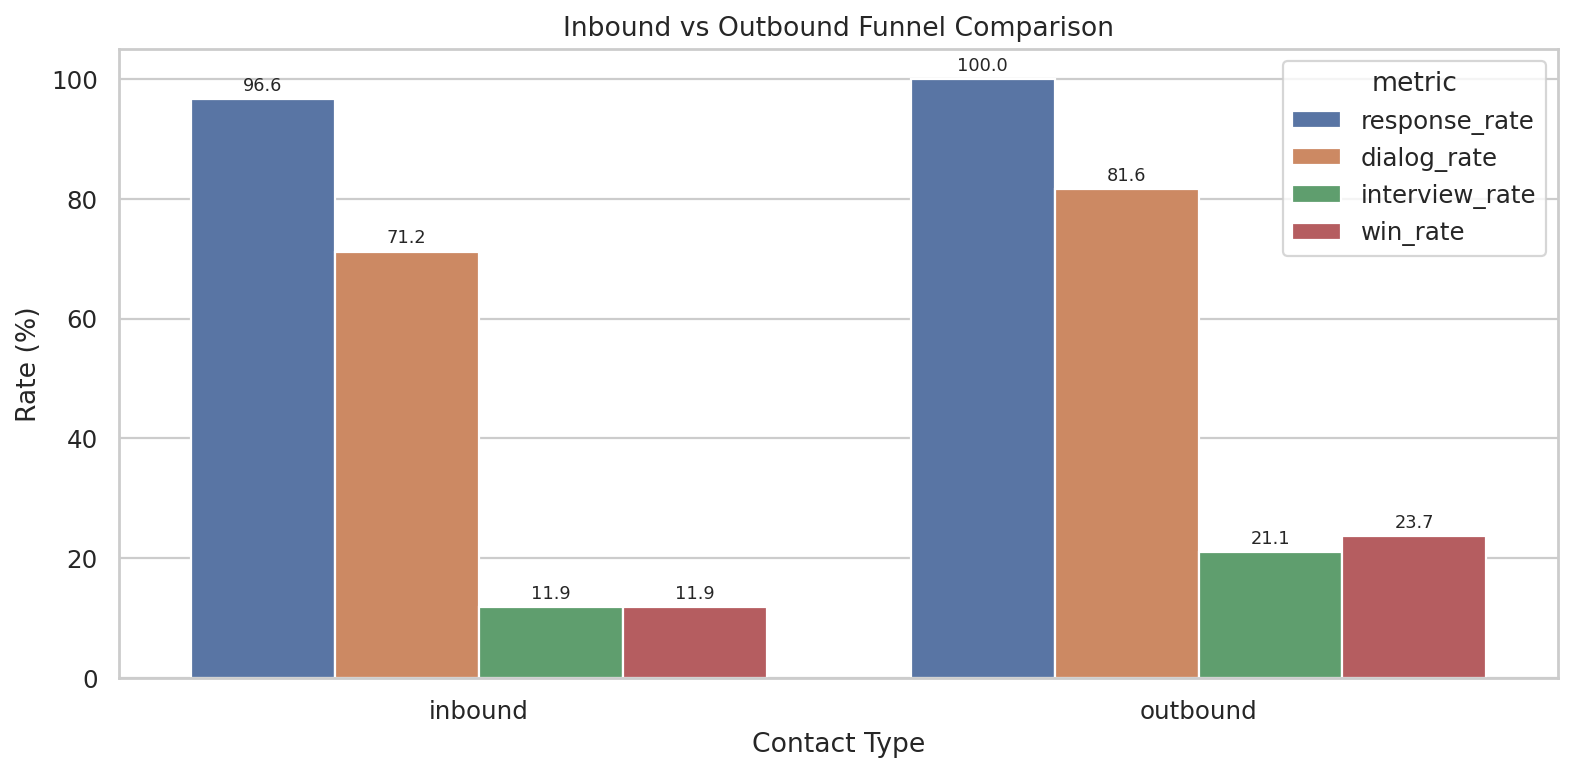
Inbound vs Outbound Rates
Proposal Comparison (Normal vs Unknown)
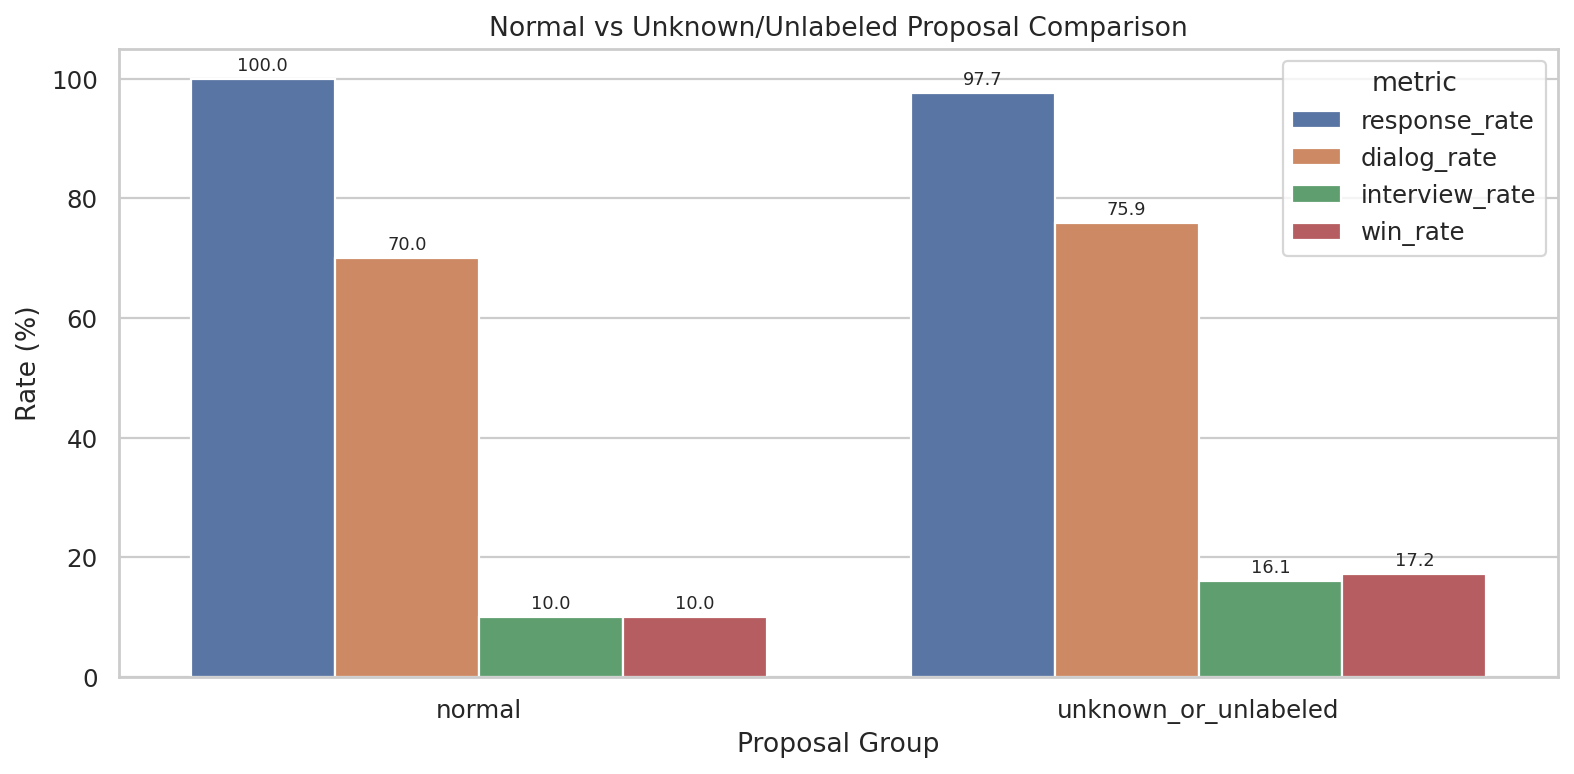
- Contact initiation (inbound vs outbound) is a cleaner strategic lens than proposal_type for this dataset.
- The very high response/dialog rates likely reflect curated conversation records rather than raw proposal exports.
Segmentation Analysis
Performance breakdown by industry, task type, country, and more
By Industry
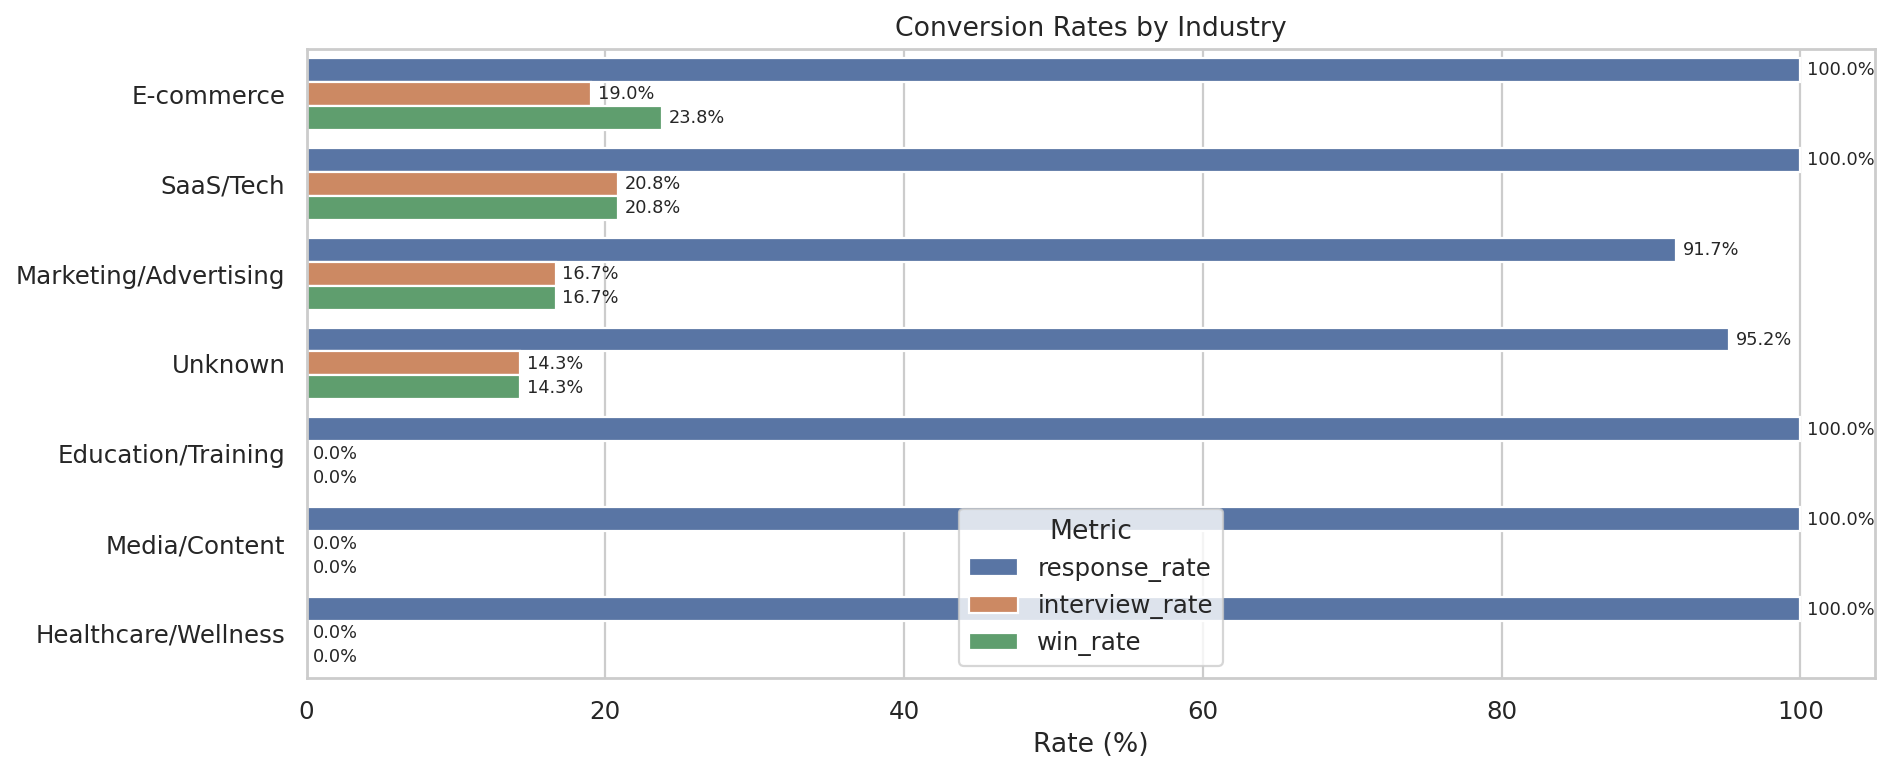
Win Rate by Industry
By Task Type
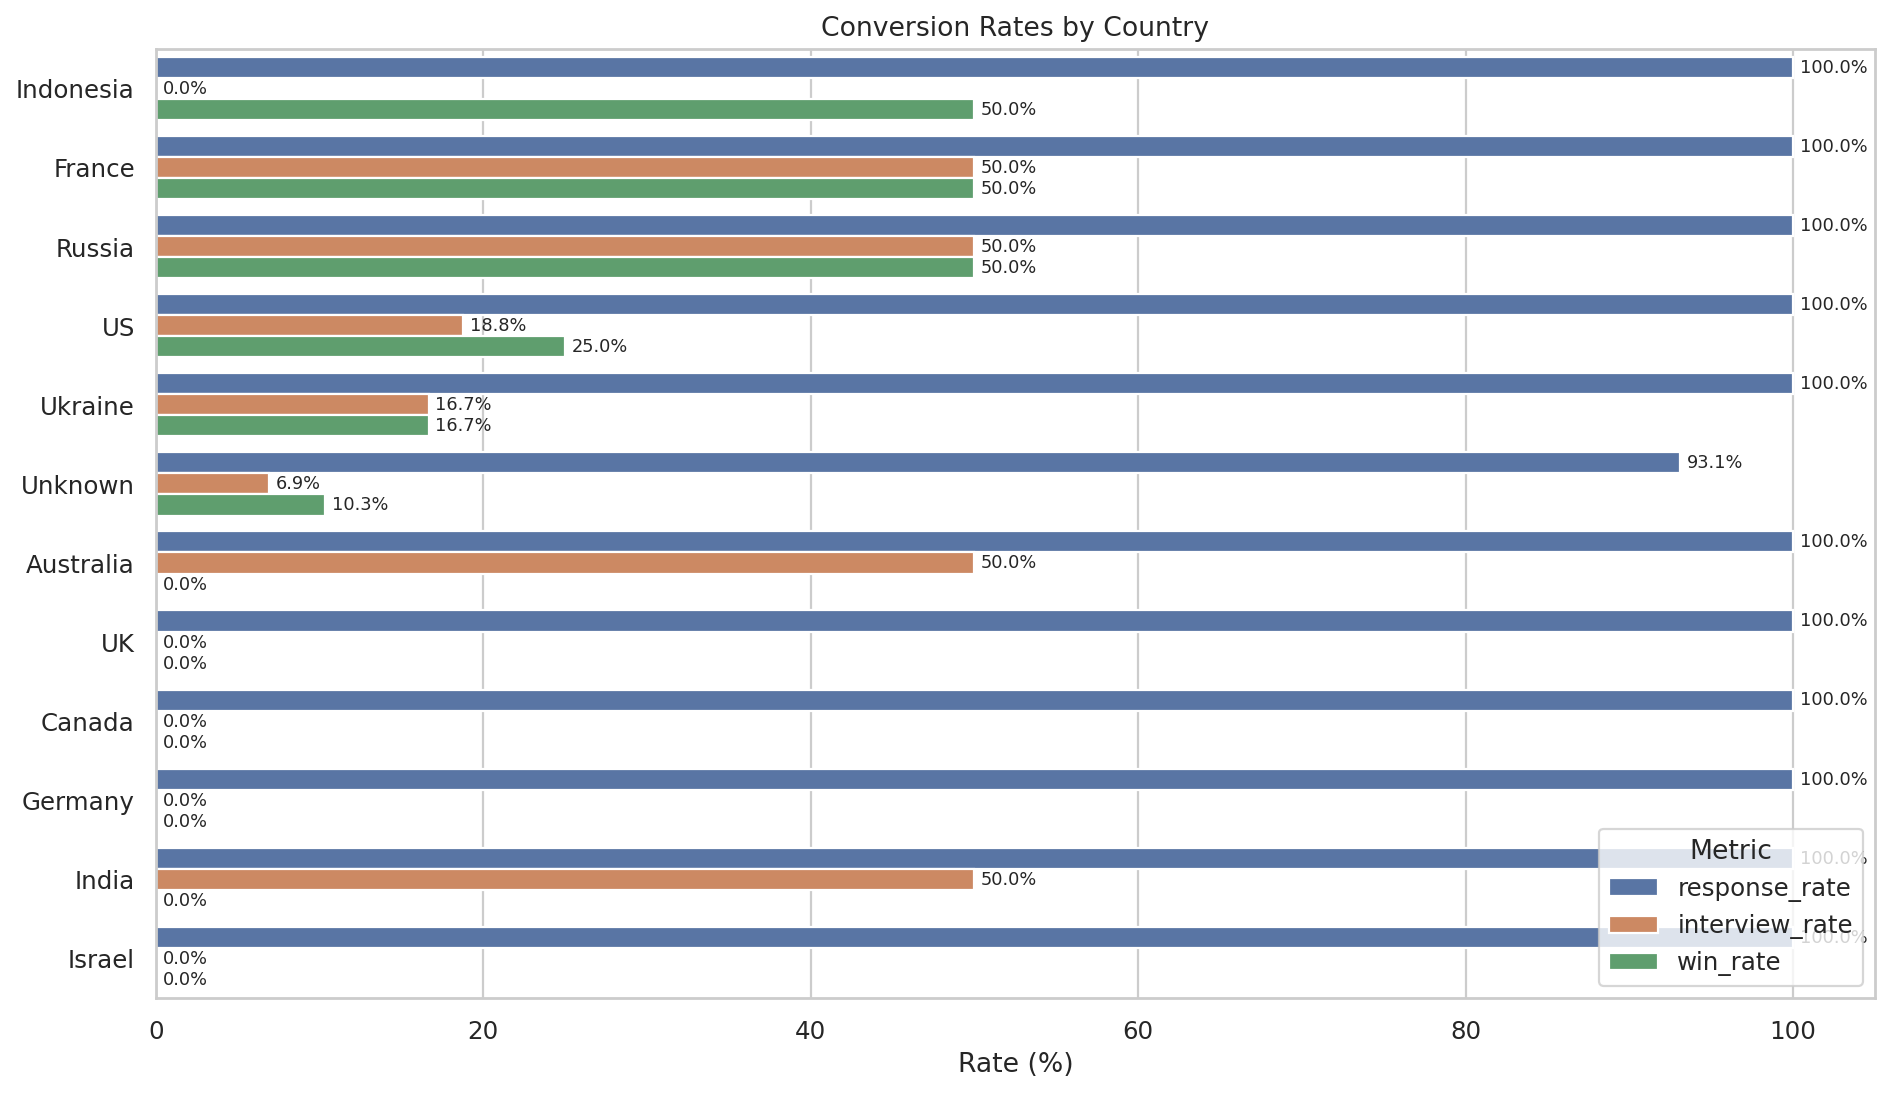
By Country
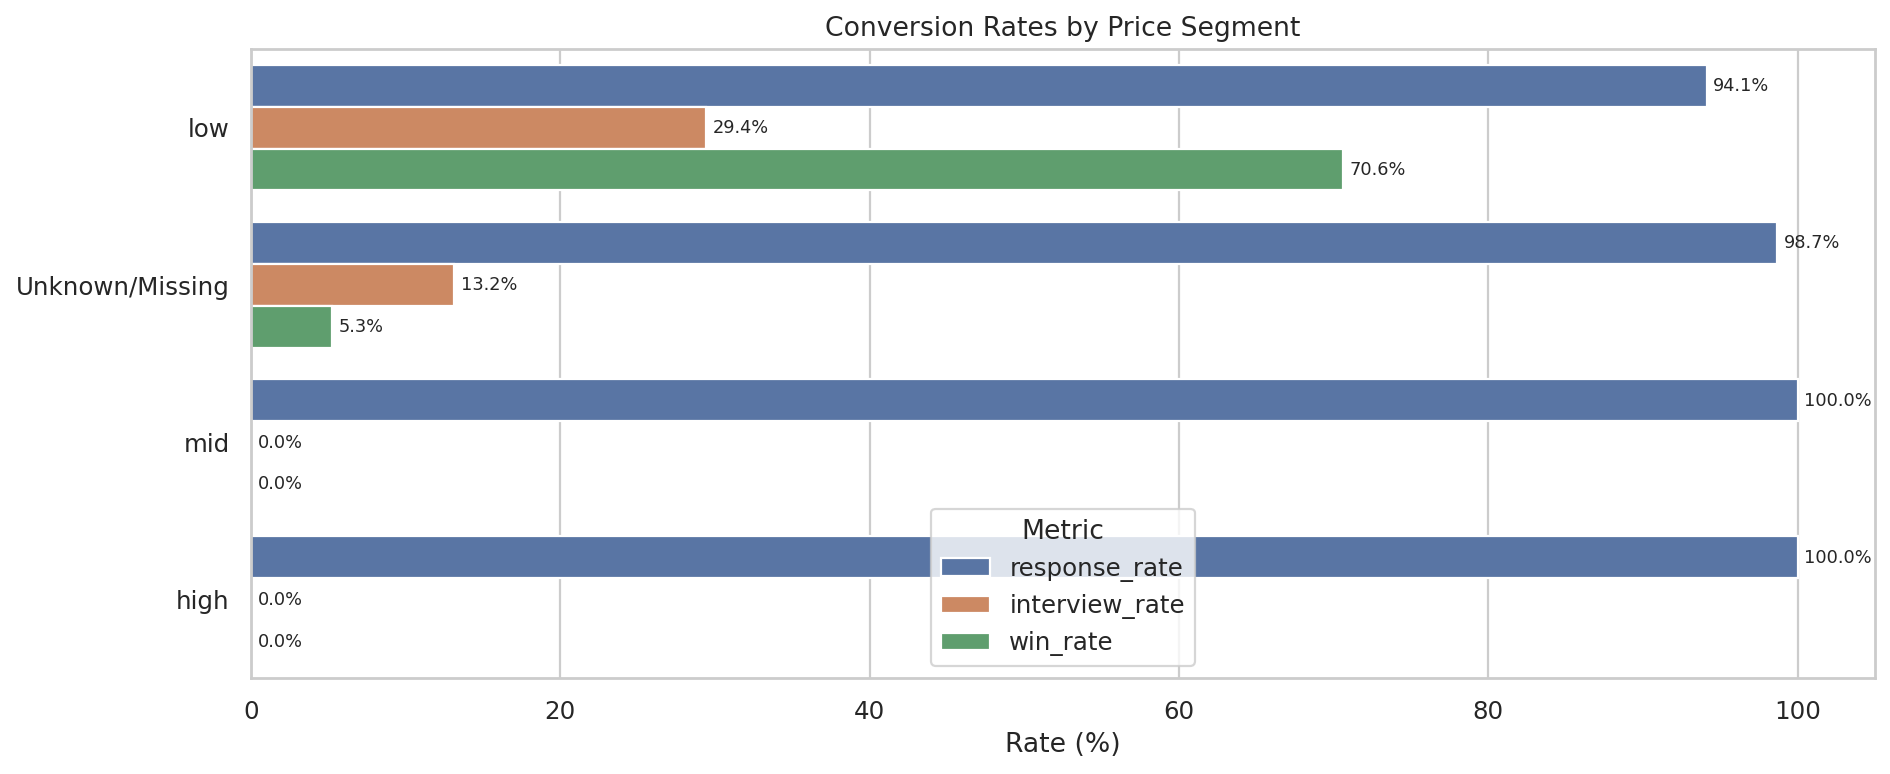
By Price Segment
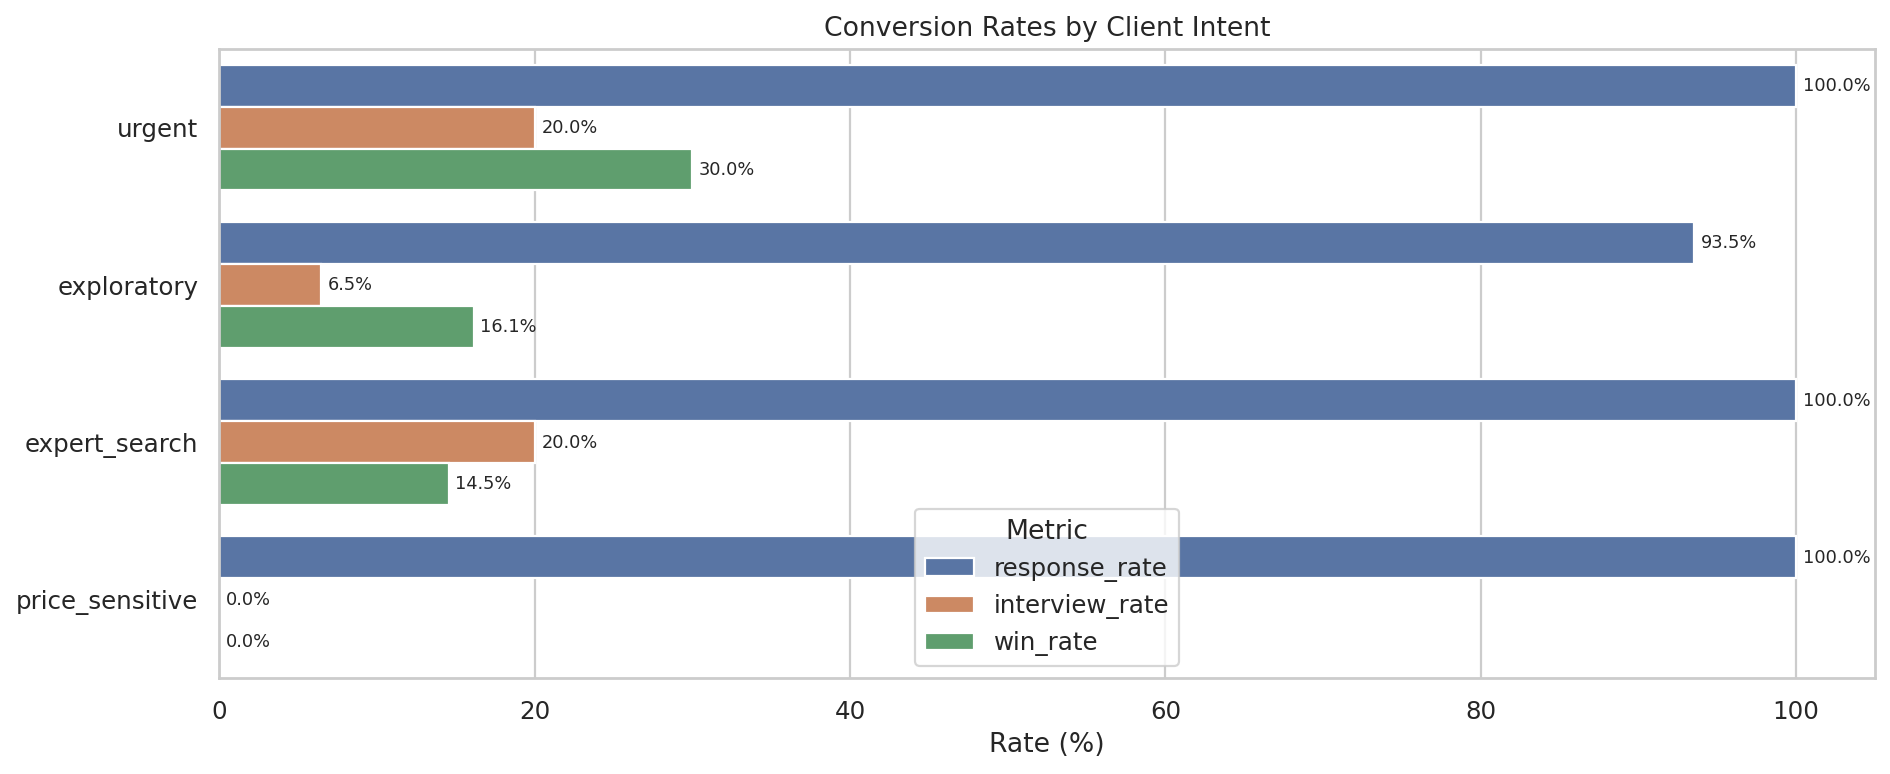
By Client Intent
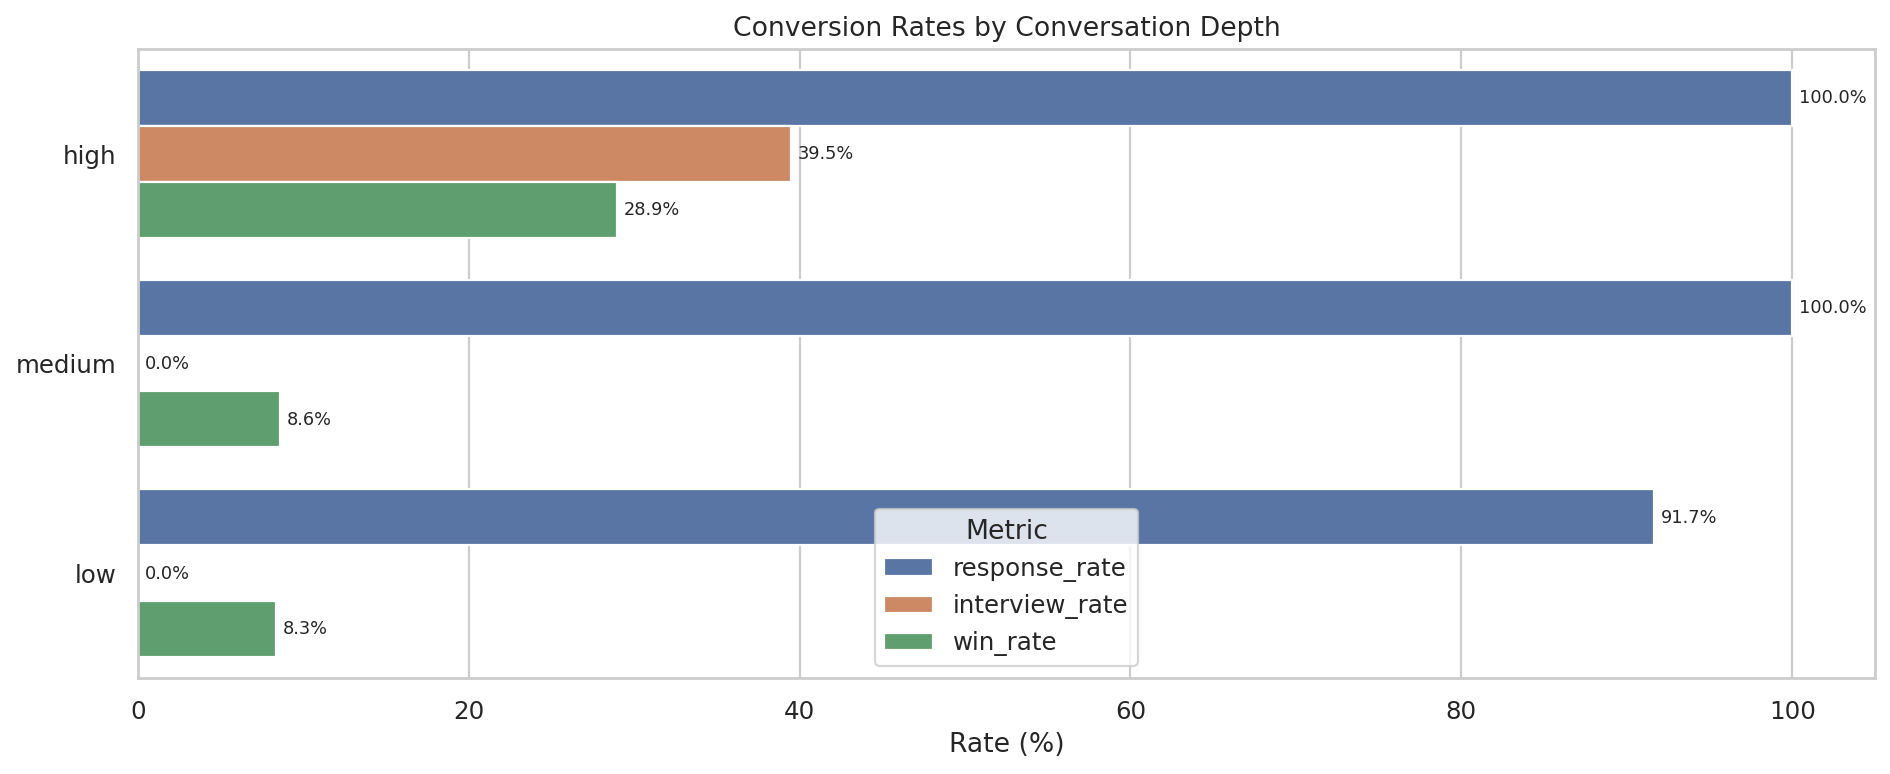
By Conversation Depth
- Highest-win industry (min 3 cases): E-commerce at 23.8%.
- Highest-win task type (min 2 cases): analytics_migration at 50.0%.
- Best intent by win rate: urgent at 30.0%.
- Best conversation depth by win rate: high at 28.9%.
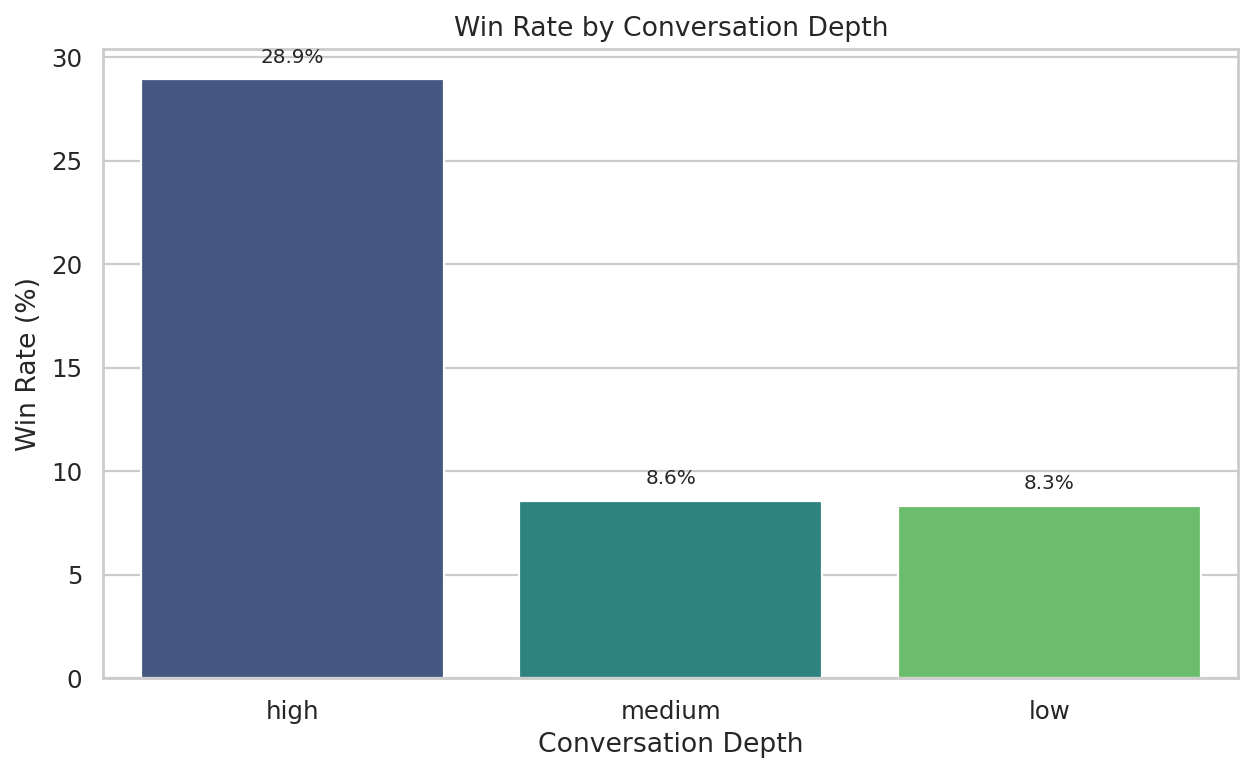
- High-depth conversations likely indicate better qualification and stronger client commitment, not just longer messaging.
Revenue Analysis
Financial performance and deal economics
Won Contracts
16
With Final Budget
10/16
Confirmed Revenue
$713
Booked Proxy
$1014
Rev/Proposal (confirmed)
$7.35
Repeat Client Wins
7/16 (43.8%)
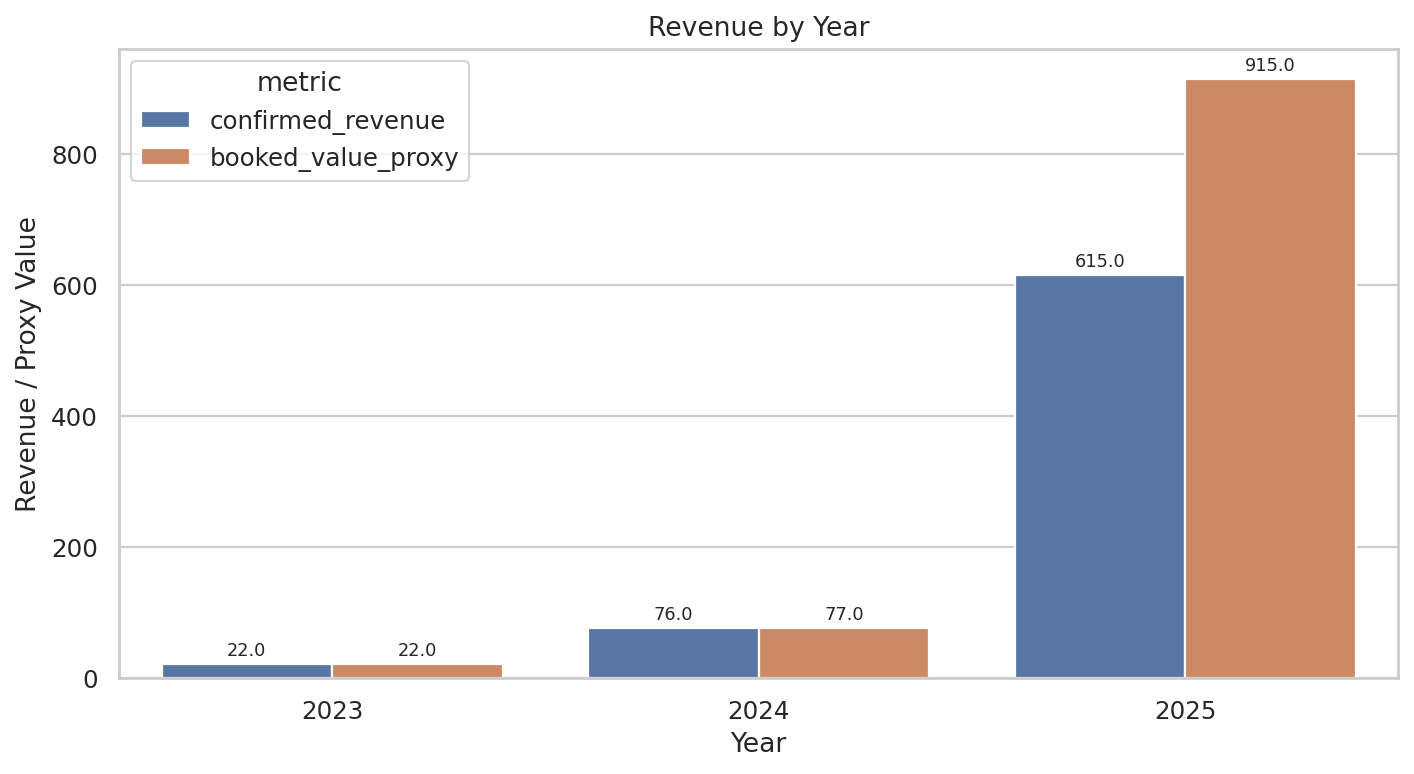
Revenue by Year
Revenue by Year (Interactive)
Top Won Clients by Revenue
| Client | Year | Country | Industry | Source | Task | Repeat | Final $ | Proxy $ |
|---|---|---|---|---|---|---|---|---|
| client_097 | 2025 | US | SaaS/Tech | outbound | dashboard_reporting | No | $450 | $450 |
| client_096 | 2025 | US | E-commerce | inbound | analytics_audit | No | — | $300 |
| client_051 | 2025 | Unknown | E-commerce | outbound | analytics_reporting | No | $35 | $35 |
| client_060 | 2025 | France | SaaS/Tech | inbound | analytics_setup | Yes | $35 | $35 |
| client_065 | 2025 | US | Marketing/Advertising | inbound | analytics_setup | Yes | $35 | $35 |
| client_069 | 2025 | US | SaaS/Tech | inbound | dashboard_reporting | No | $35 | $35 |
| client_012 | 2024 | Unknown | SaaS/Tech | outbound | power_bi_reporting | Yes | $26 | $26 |
| client_017 | 2024 | US | SaaS/Tech | outbound | analytics_setup | No | $25 | $25 |
| client_070 | 2024 | US | E-commerce | inbound | tag_management | No | $25 | $25 |
| client_089 | 2025 | US | Non-profit | inbound | dashboard_reporting | Yes | $25 | $25 |
- Largest single won deal: $450.
- Revenue growing: $22 (2023) → $77 (2024) → $915 proxy (2025).
- Repeat clients contribute meaningful share of revenue despite being minority of contracts.
- Because some active contracts have no explicit final budget, real value of retained/ongoing work is likely understated.
Behavioral Analysis
Dropoff patterns, client intent, and conversation depth
Where Clients Drop Off
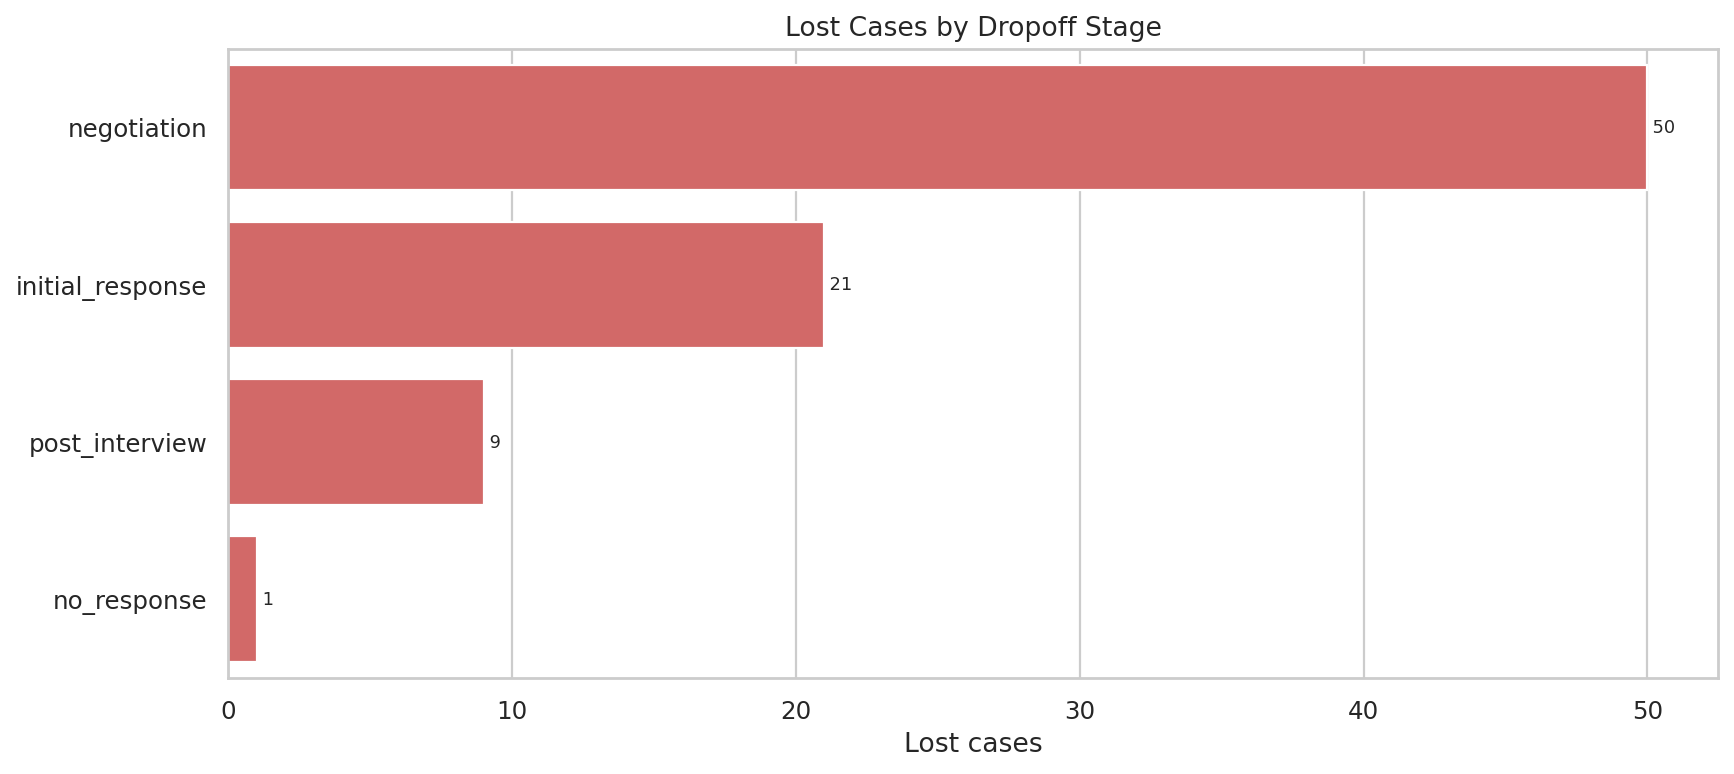
Dropoff Stage Distribution
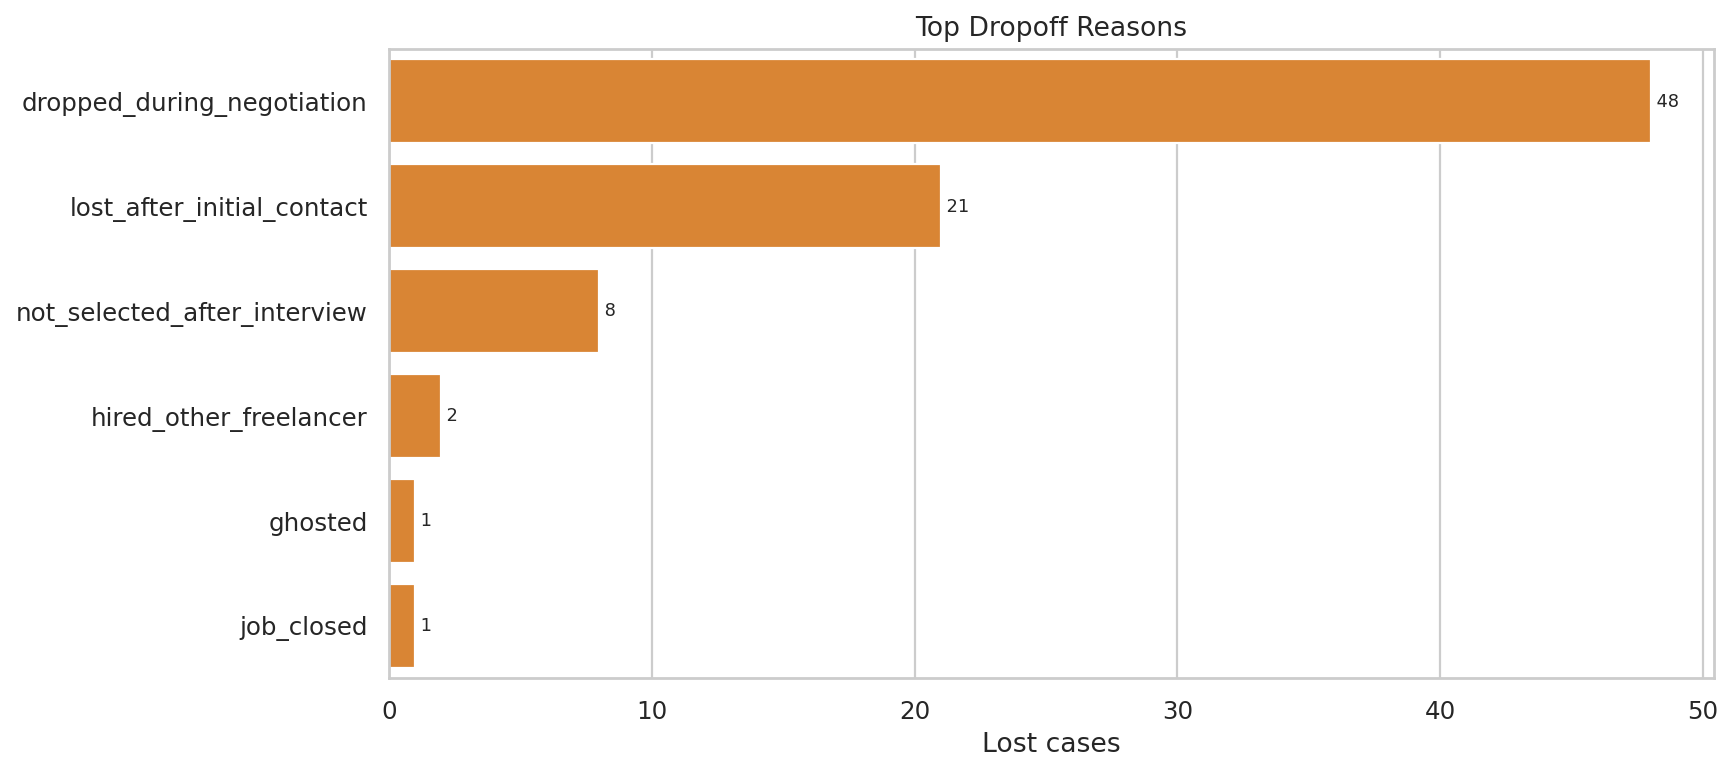
Most Common Dropoff Reasons
- Main loss stage: negotiation with 50 lost cases.
- Top loss reason: dropped_during_negotiation with 48 cases.
- Post-interview losses total 9 — most expensive in terms of effort invested.
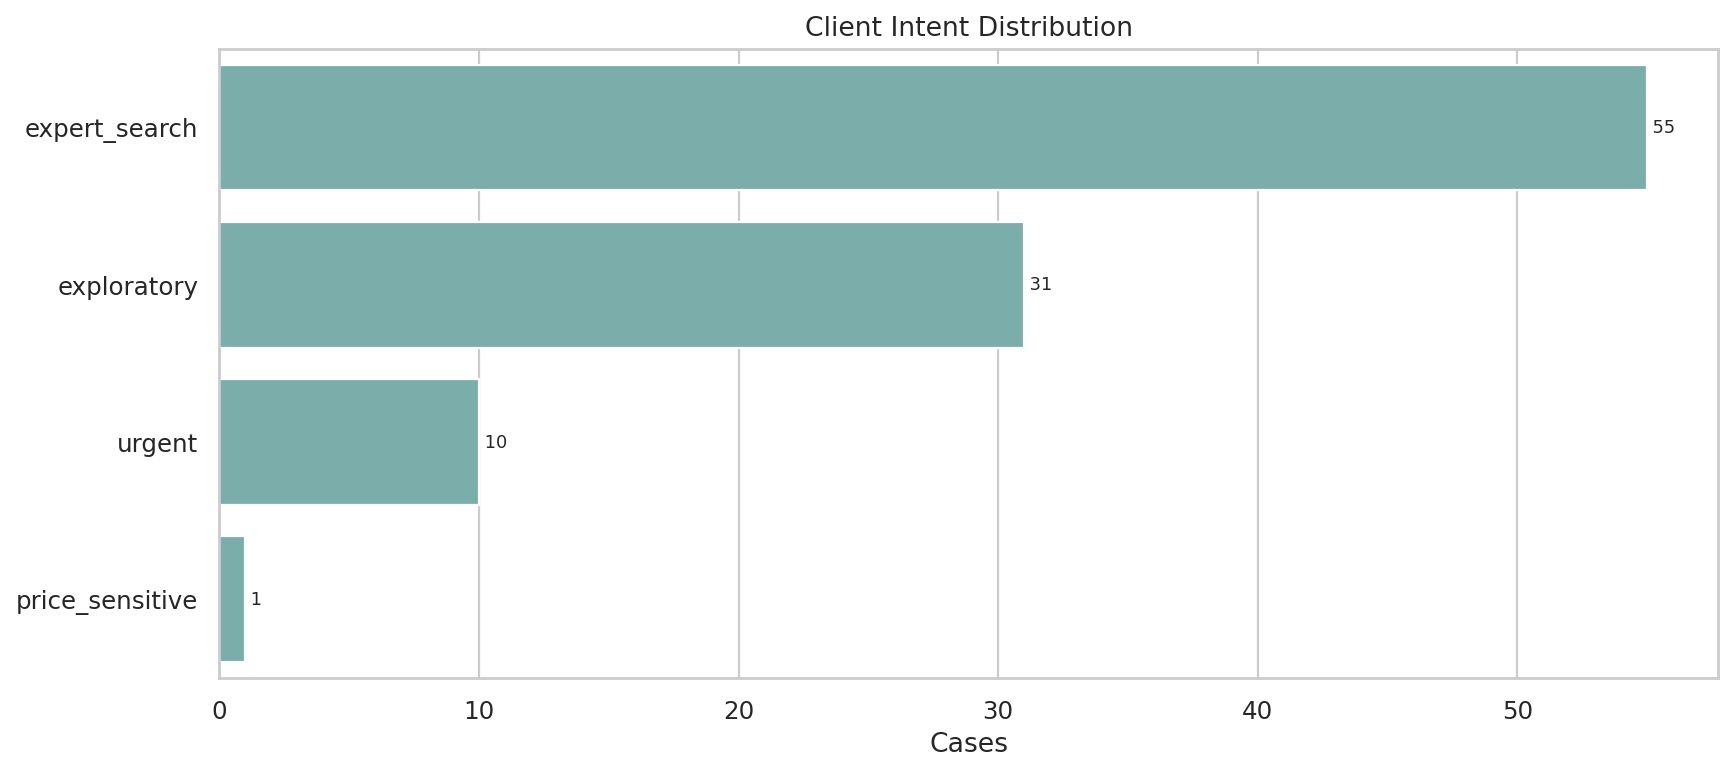
Client Intent Distribution
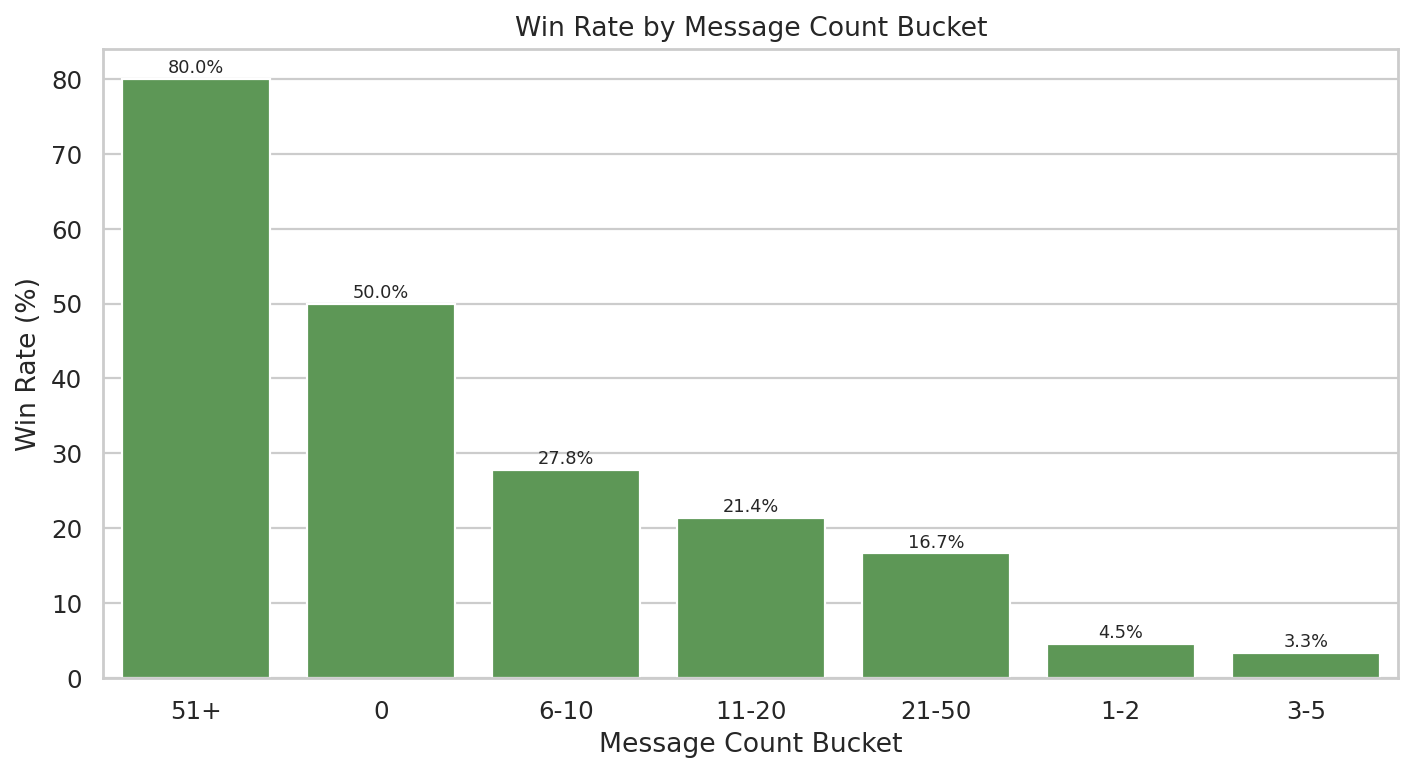
Conversation Depth vs Win Rate
Message Count Bucket vs Win Rate
- Most common intent: expert_search with 55 cases.
- Best-converting intent: urgent at 30.0% win rate.
- Win rate by depth: low 8.3%, medium 8.6%, high 28.9%.
- Negotiation-stage dropoff suggests positioning/pricing/scope-framing issues more than top-of-funnel visibility.
- More messages are not inherently better — deeper engagement likely reflects already-qualified clients.
Ideal Client Profile
Best-performing segments that define your ideal customer
Indonesia
50.0% win rate (2/4 cases)
E-commerce
23.8% win rate (5/21 cases)
Low range
70.6% win rate (12/17 cases)
analytics_migration
50.0% win rate (1/2 cases)
Outbound
23.7% win rate (9/38 cases)
Urgent
30.0% win rate (3/10 cases)
High
28.9% win rate (11/38 cases)
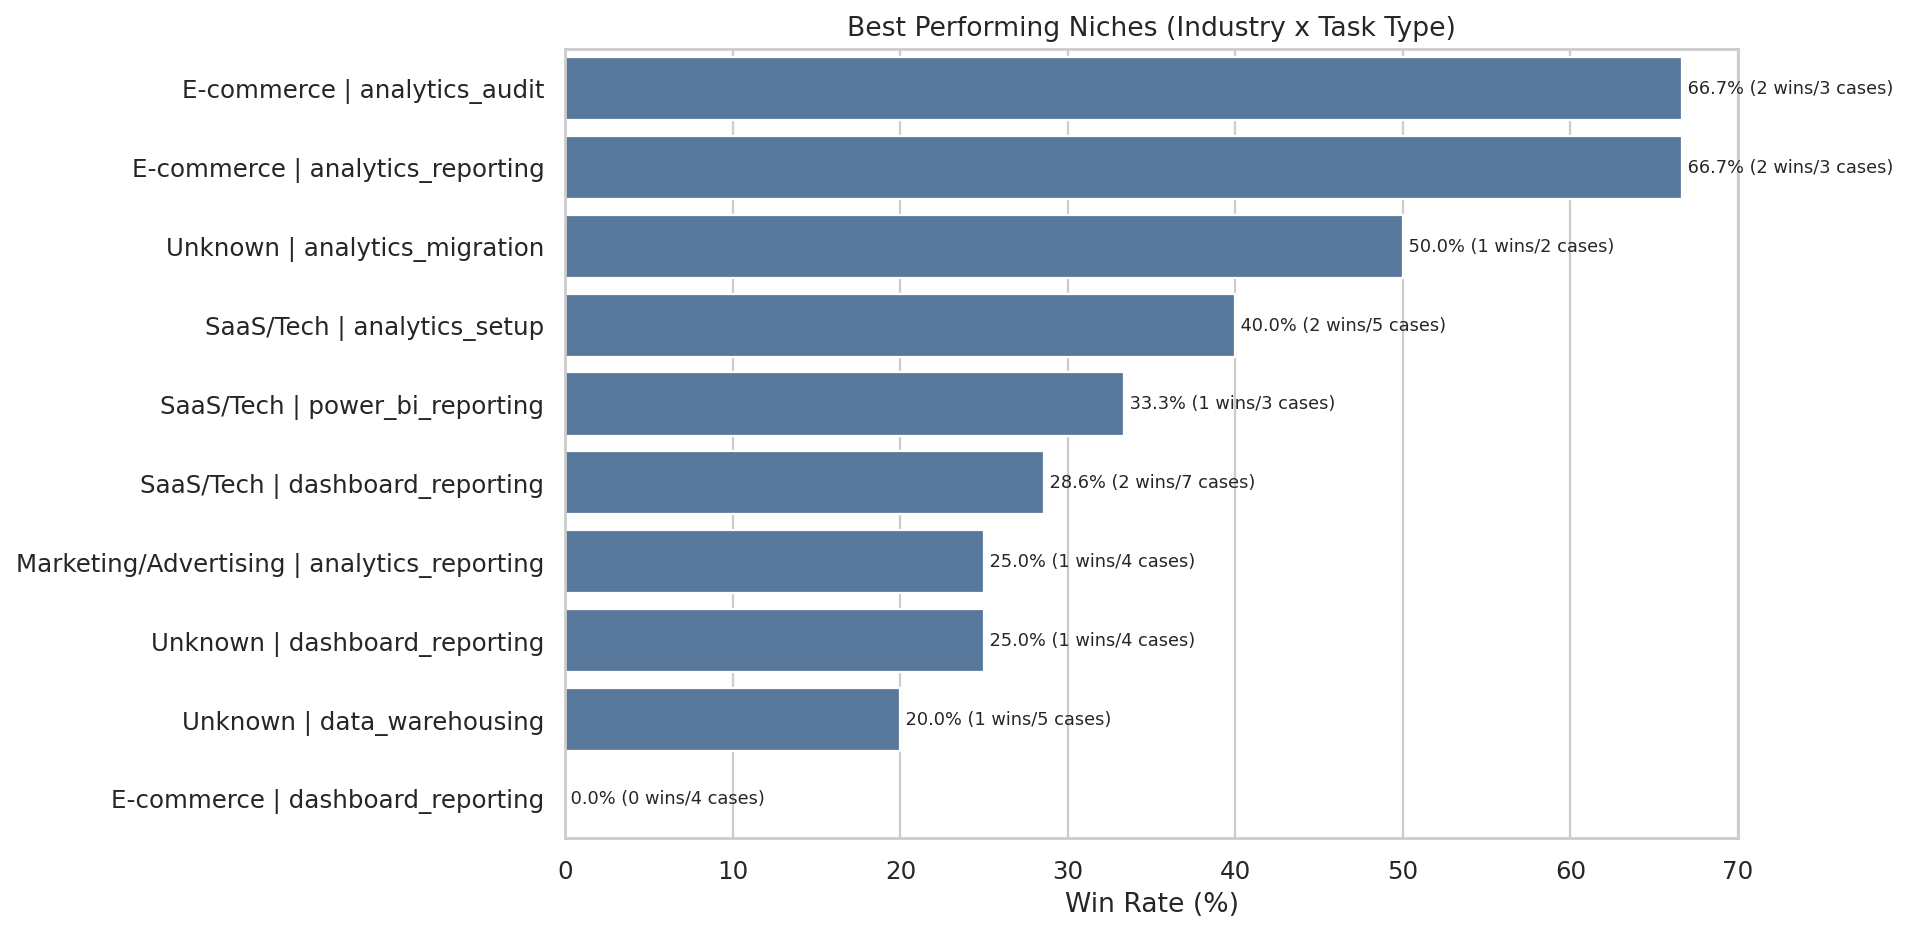
Best Performing Niches
- The ideal ICP is a client who already knows they need an analytics expert, enters a real conversation quickly, and has a clearly scoped dashboard/setup/audit problem rather than a vague exploratory request.
Errors & Money Losses
Estimated lost revenue and high-potential missed opportunities
Lost Cases (known budget)
9
Lost Value Proxy
$4,586
High-Potential Lost Cases
30
High-Potential Lost Value
~$4,525
Top High-Potential Lost Clients
| Client | Year | Country | Industry | Source | Task | Depth | Dropoff | Budget |
|---|---|---|---|---|---|---|---|---|
| client_086 | 2025 | Unknown | SaaS/Tech | inbound | analytics_reporting | medium | negotiation | $2500 |
| client_084 | 2025 | Ukraine | Media/Content | inbound | dashboard_reporting | high | negotiation | $700 |
| client_071 | 2025 | US | E-commerce | inbound | dashboard_reporting | medium | negotiation | $500 |
| client_077 | 2025 | Australia | E-commerce | inbound | dashboard_reporting | medium | negotiation | $500 |
| client_093 | 2025 | Indonesia | SaaS/Tech | inbound | power_bi_reporting | high | negotiation | $300 |
| client_066 | 2025 | Unknown | SaaS/Tech | outbound | analytics_reporting | medium | negotiation | $35 |
| client_011 | 2024 | Unknown | Marketing/Advertising | inbound | power_bi_reporting | low | no_response | $26 |
| client_062 | 2025 | US | Marketing/Advertising | inbound | analytics_reporting | high | negotiation | $15 |
| client_054 | 2025 | Italy | Marketing/Advertising | inbound | dashboard_reporting | high | negotiation | $10 |
| client_003 | 2024 | Australia | Unknown | inbound | data_warehousing | high | post_interview | — |
- The loss pool is dominated by negotiation-stage failures, not pure non-response.
- Several lost leads had both high conversation depth and explicit budgets — effort was invested without conversion.
- Most expensive misses likely come from under-qualification, scope ambiguity, and insufficient anchoring of value during negotiation.
Growth Opportunities
Segments to scale, best niches, and areas to deprioritize
Segments to Scale
| Industry | Cases | Wins | Win Rate | Booked Value | Value/Case |
|---|---|---|---|---|---|
| E-commerce | 21 | 5 | 23.8% | $361 | $17.19/case |
| SaaS/Tech | 24 | 5 | 20.8% | $571 | $23.79/case |
| Marketing/Advertising | 12 | 2 | 16.7% | $35 | $2.92/case |
Best Performing Niches
| Industry | Task Type | Cases | Wins | Booked Value | Win Rate |
|---|---|---|---|---|---|
| E-commerce | analytics_audit | 3 | 2 | $300 | 66.7% |
| E-commerce | analytics_reporting | 3 | 2 | $36 | 66.7% |
| SaaS/Tech | analytics_setup | 5 | 2 | $60 | 40.0% |
| SaaS/Tech | dashboard_reporting | 7 | 2 | $485 | 28.6% |
Deprioritize (0% Win Rate Task Types)
| Task Type | Cases | Wins | Win Rate |
|---|---|---|---|
| conversion_tracking | 7 | 0 | 0% |
| ecommerce_tracking | 5 | 0 | 0% |
| ga4_analytics | 4 | 0 | 0% |
| bug_fix | 3 | 0 | 0% |
| tracking_setup | 3 | 0 | 0% |
- Segments with strong win rate plus deeper conversations are the best candidates for systematized offers or productized packages.
- Segments with many responses but zero wins likely need either a sharper qualification rule or completely different offer framing.
Action Plan
Strategic actions based on data-driven insights
STOP Doing
- Deprioritize task types with 3+ cases, high response, and 0 wins (conversion_tracking, ecommerce_tracking, ga4_analytics, bug_fix, tracking_setup).
- Stop treating every negotiation as recoverable — 50 losses at negotiation stage. Tighten qualification before detailed scoping.
- Stop relying on proposal_type for strategic conclusions — the field is mostly unlabeled.
SCALE
- Scale best-performing industries and niches, especially those combining above-average win rate with actual booked value.
- Double down on outbound-origin cases for conversion efficiency (23.7% vs 11.9%).
- Build repeat-client motions — repeat wins account for 12.0% of covered won revenue.
RAISE Prices
- Test higher anchors in segments with strong conversion and larger deal sizes.
- For urgent / expert-search clients with high-depth conversations, test premium rate card or packaged audit/setup offers.
- Where you have repeated wins at similar rates ($25-35 tickets), test incremental increases.
IMPROVE Proposals
- For outbound, lead with sharper business outcome statements — outbound already converts well and may improve with clearer ROI framing.
- Add stronger scope boundaries for negotiation-heavy jobs to reduce dropped_during_negotiation losses.
- For exploratory clients, use paid discovery or audit-first offers instead of open-ended solutioning.
INCREASE Conversion
- Create a negotiation playbook: value framing, scope options, timeline options, fallback low-friction starter package.
- Fast-track interview/post-interview cases with structured next-step CTAs — high-effort opportunities.
- Use conversation-depth signals: when threads reach medium/high engagement, move quickly to concrete paid next step.
FACTS vs HYPOTHESES discipline: Every action above is based on observed funnel, segment, revenue, and dropoff tables. Any recommendation about why a segment performs is still a hypothesis until validated with message-level qualitative review or A/B testing.
Upwork Analytics Dashboard · Data covers 97 cases from 2023–2025